Data visualization
STEP 10
Data used for visualization

With route.plus you can create reports and visualizations of data based on maps. To use this module we need the following data:
- Transactional data such as sales or distribution of products. This data must be imported into the file including the customer ID they are referring to. The data can be further supplemented with additional data, after which it will be possible to filter by e.g. products or product groups or distributors.
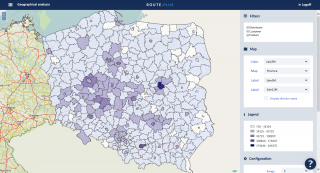
- Territorial data. If you have designed territories in your system, you will be able to use them as a map layer for visualization. If you have not done so, you will only be able to benefit from administrative divisions like counties or municipalities. The image on the left shows the sales value for one distributor for the last 12 months shown on the basis of the district layers.

Such reports can be used, for example, to generate sales effectiveness reports, reach individual distributors or product groups.
